
Mapping the Broadband Experience: Redesigning Data Tools for Advocacy and Equity
UX Research • Participatory Design • Storytelling • Data Visualization
Role: Lead UX Researcher (Master’s Thesis)
Funding: National Science Foundation (NSF)–supported research on rural broadband and digital equity
Timeline: 2024–2025
Methods: Interviews, qualitative analysis, participatory co-design, storytelling, mapping
Domain: Civic technology · Infrastructure · Digital equity
“How might broadband maps be redesigned to reflect residents’ lived experiences and better support advocacy and policy decisions in rural communities?”
Broadband maps shape how infrastructure investments and policy decisions are made, yet they often fail to capture the lived realities of rural residents. This project explores how storytelling and participatory design can make broadband maps more equitable and meaningful for community advocacy.
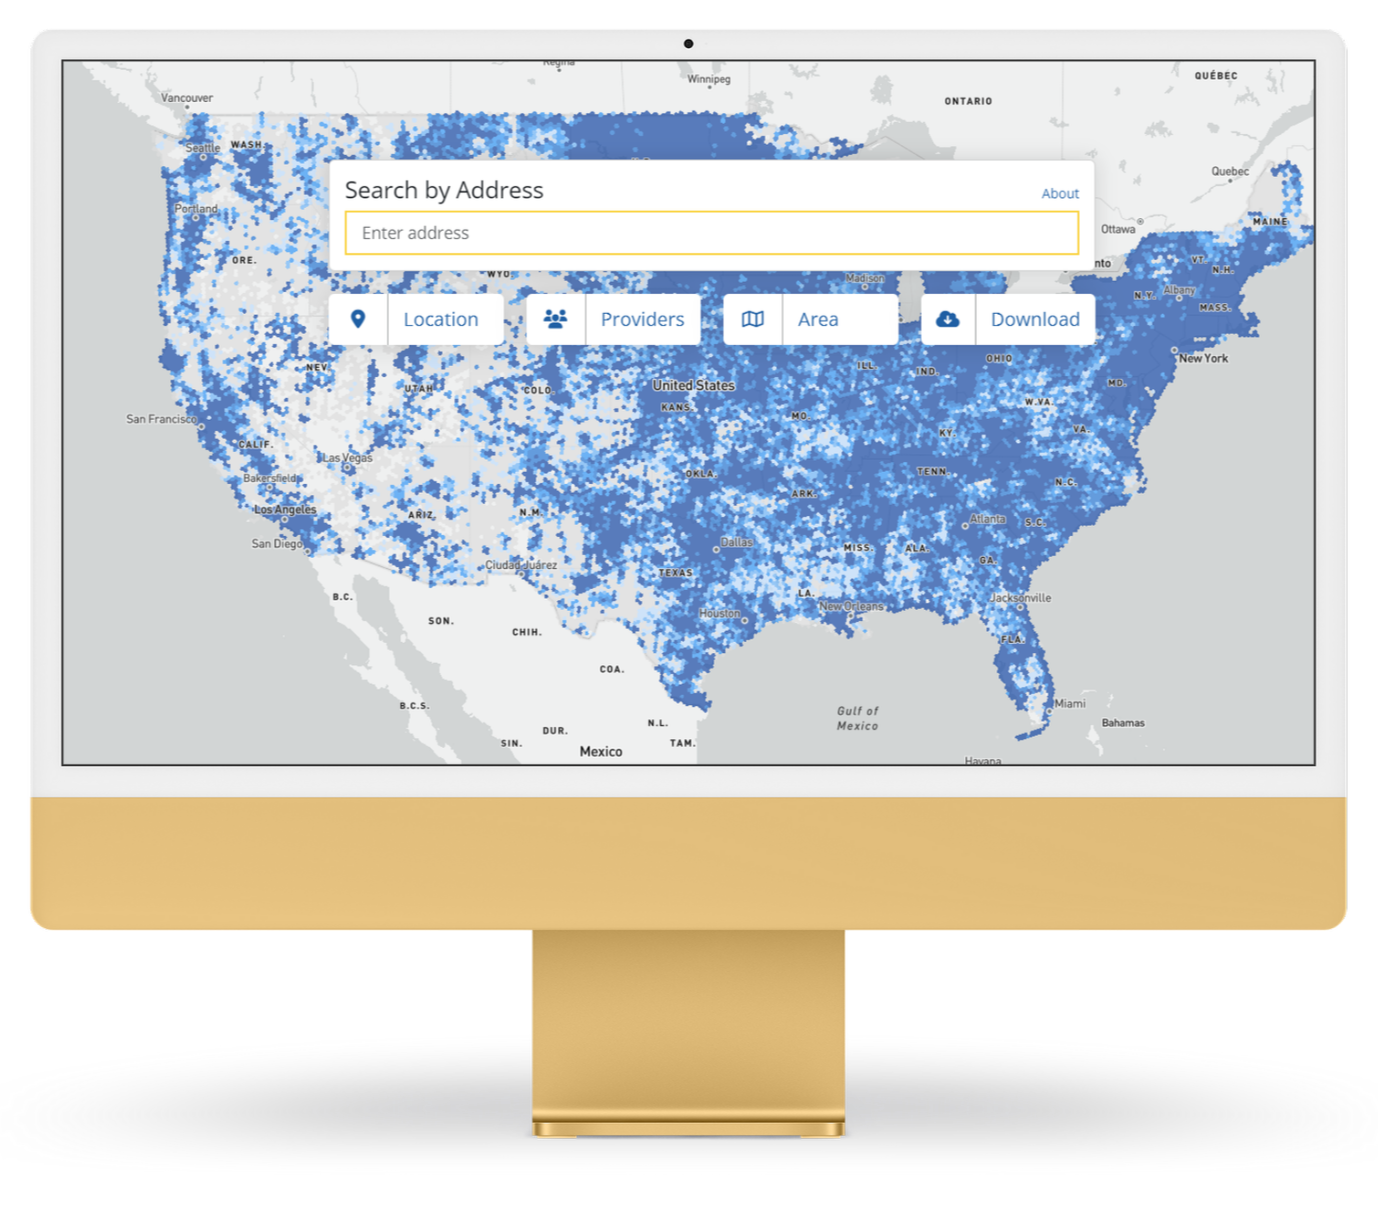
FCC Broadband Map
The Problem
Broadband maps determine where infrastructure funding goes — but they rely on Internet Service Provider (ISP)-reported availability data that often fails to reflect affordability, reliability, and lived experience.
As a result, broadband workers struggle to advocate for underserved rural and immigrant communities.
What I Was Responsible For
Led end-to-end research as my Master’s thesis
Interviewed broadband workers across California
Synthesized public broadband stories into a taxonomy
Facilitated a participatory co-design workshop
Translated findings into new map design elements
Key Design Decision
Shift broadband maps from availability-focused tools to advocacy-oriented tools grounded in lived experience.
Instead of improving speed or coverage precision alone, I centered the realities broadband workers face when supporting communities.
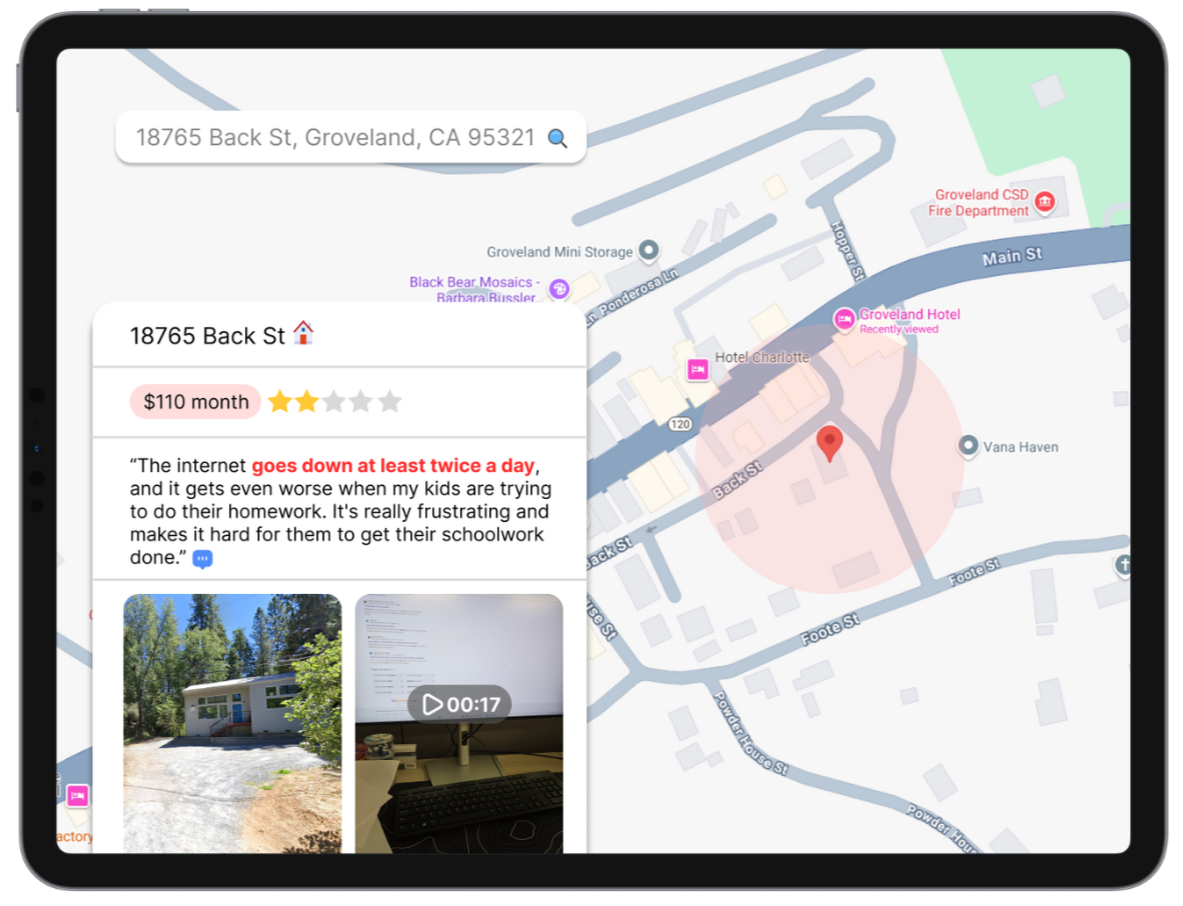
Conceptual example of a narrative-enhanced broadband map, illustrating how resident stories and lived experiences could be layered onto geographic data to support advocacy work.
All addresses, locations, and media shown are mock content for demonstration purposes.
What I Found
Through interviews, story analysis, and co-design, four map elements emerged as critical for advocacy:
Primary Language Spoken – to support trust and outreach
Internet Cost – to surface affordability barriers
Household Density – to reflect shared usage realities
Internet Access Hub Locations – to highlight community support ecosystems
These elements reframed broadband maps as community-centered tools rather than static datasets.
A Critical Insight
Many low-income immigrant residents do not perceive home internet as necessary due to:
Low digital literacy
Fear of scams
Reliance on family members
This challenges the assumption that broadband adoption is universal — and reshapes how advocacy tools should be designed.
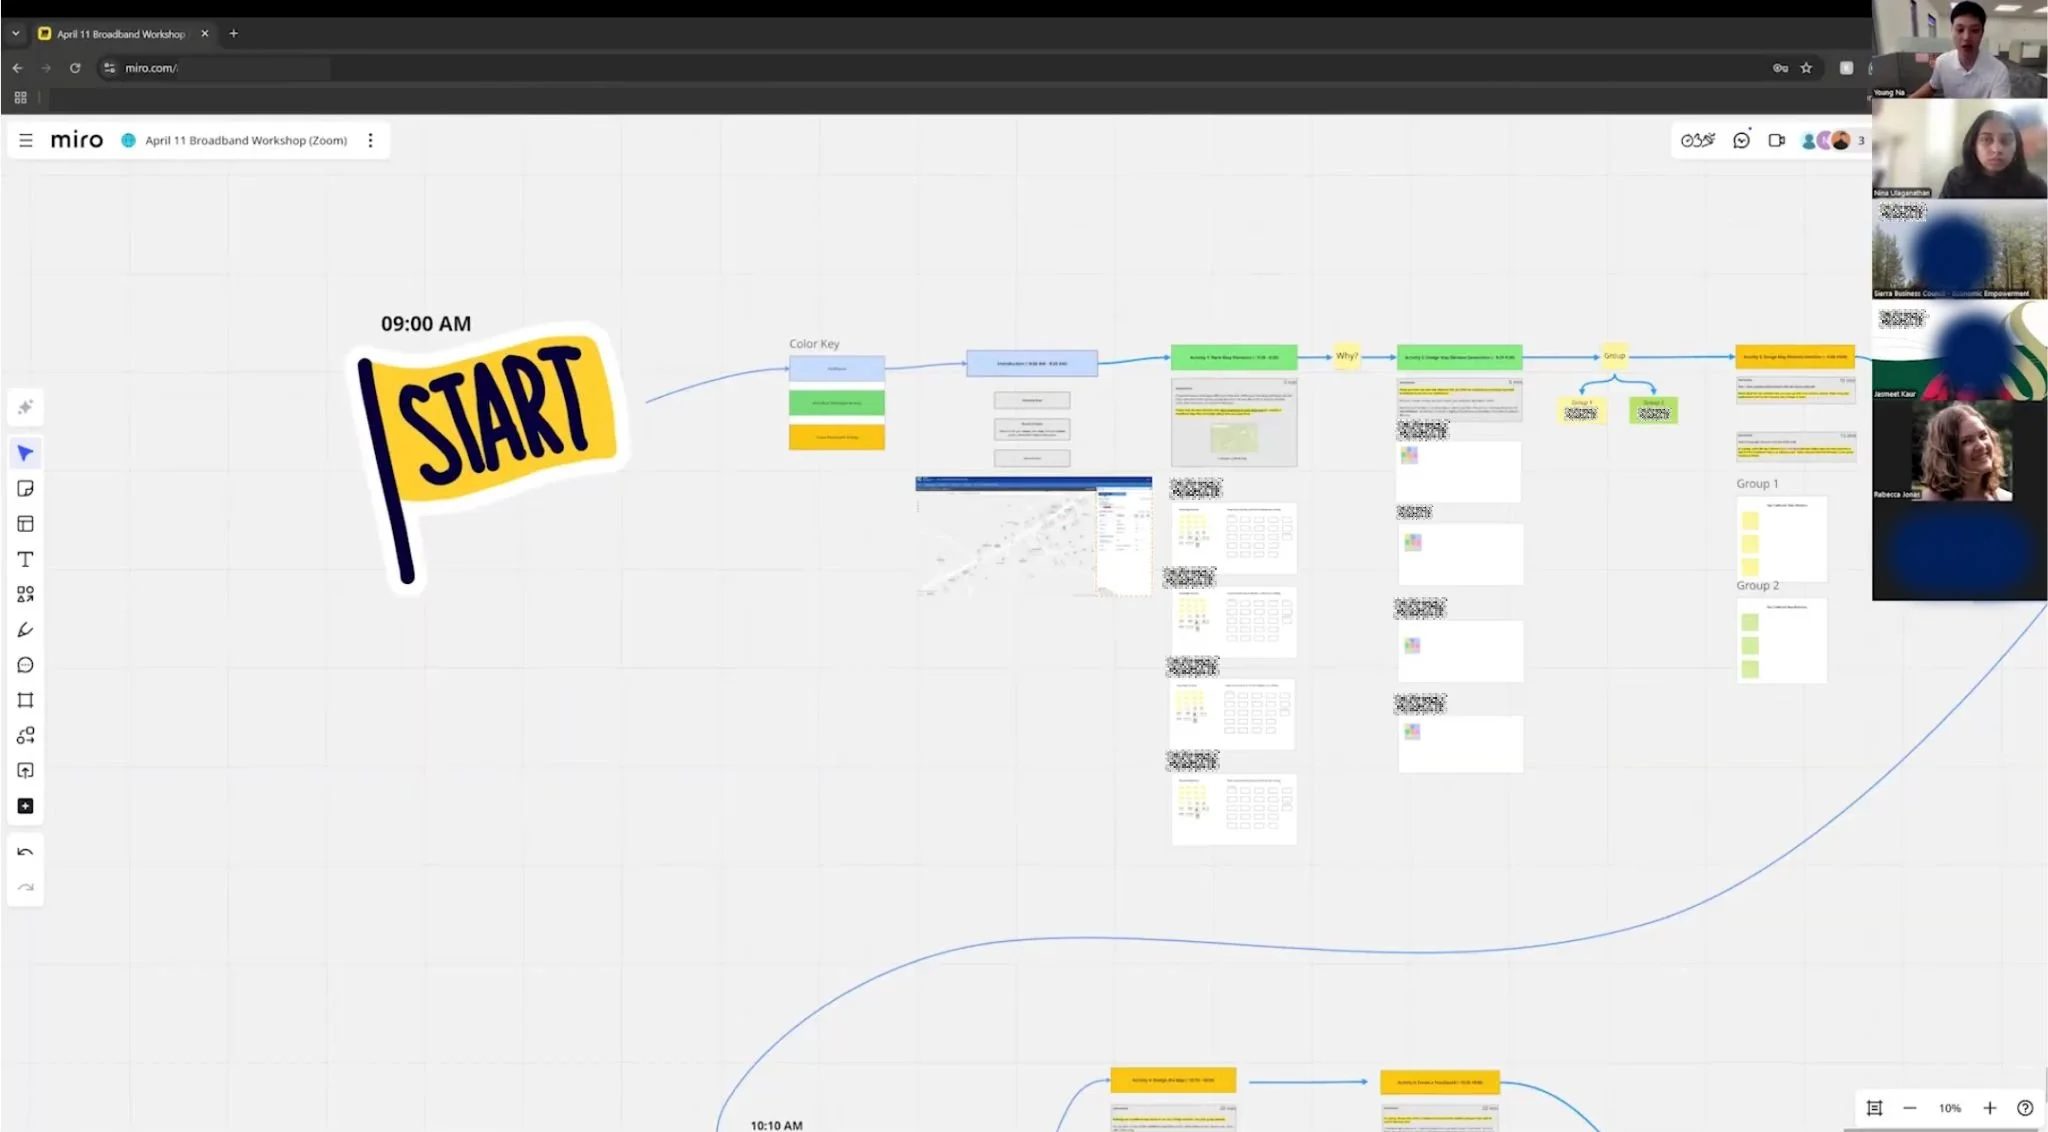
Screenshot from a virtual co-design workshop with broadband workers, where participants collaboratively evaluated and redesigned broadband map elements based on advocacy needs and lived experience.
Impact
Identified four actionable broadband map elements
Reframed maps as tools for equity-driven advocacy
Findings shared with broadband advocacy networks
Contributed to HCI research on community-centered data design
Want to dig deeper?
The outcomes above are the result of a series of research and design decisions made under real advocacy constraints. The sections below unpack how those decisions were made.
Project Framing
Broadband maps play a critical role in determining where infrastructure funding is allocated and which communities receive support. In practice, these maps are primarily built from ISP-reported availability data, which often overstates access and fails to reflect the realities residents experience on the ground—such as affordability, reliability, language barriers, and digital literacy challenges.
Through early conversations with broadband workers in California, I learned that these maps are not just technical artifacts; they are everyday tools used in advocacy, grant writing, and policymaker engagement. However, because current maps prioritize coverage over lived experience, broadband workers often spend significant time verifying data address by address or supplementing maps with anecdotes that are disconnected from the map itself.
Rather than attempting to make broadband maps more precise in a purely technical sense, I framed this project around a different question: how might broadband maps be redesigned to better support advocacy work by making residents’ lived experiences visible and legible? This framing intentionally shifted the focus from infrastructure availability alone to the sociocultural and economic realities that shape whether internet access is meaningful in rural communities.
Research Approach
The study followed a three-phase qualitative approach designed to examine how lived experiences might be integrated into broadband maps.
-
Semi-structured interviews were conducted with broadband workers from nonprofit and advocacy organizations in California. These conversations provided an initial understanding of how broadband maps are used in practice, what limitations broadband workers encounter, and what information is most valuable in their advocacy work.
-
Broadband-related stories were collected from public comment portals, nonprofit publications, and prior academic research. Through thematic analysis, these materials were organized into a taxonomy of 17 broadband map elements, representing recurring challenges such as affordability, reliability, service competition, and safety concerns.
-
A virtual co-design workshop was conducted with broadband workers to collaboratively evaluate and refine broadband map elements identified in earlier phases. Participants engaged in structured activities such as ranking existing elements, proposing new ones, and creating storyboards to visualize how redesigned maps might support their advocacy work.
Key Findings
Four Effective Broadband Map Elements
Participants identified four broadband map elements as particularly valuable for representing residents’ lived experiences and for strengthening advocacy work:
Primary Language Spoken — addresses language barriers and supports trust-building during outreach.
Internet Cost — visualizes local variations in affordability and reveals disparities across service areas.
Household Density — highlights multi-family or shared-housing contexts often underserved by existing infrastructure.
Internet Access Hub Location — maps community spaces that provide public internet access and digital literacy support.
Limited Perceived Need for Internet at Home
An unexpected but critical insight emerged. Many low-income immigrant residents in rural areas expressed a limited perceived need for home internet. This perspective was shaped by low digital literacy, skepticism about online safety, and reliance on younger family members for digital tasks. The finding reframes broadband inequity not only as an infrastructural issue but also as a sociocultural one rooted in trust, literacy, and perceived relevance.
Outcome
The study proposes a narrative-driven framework for broadband maps that integrates qualitative data—stories, language, and lived experiences—alongside existing quantitative metrics. By doing so, broadband maps can move beyond their current function as technical data repositories and instead operate as advocacy tools that communicate community realities and support equity-driven decision-making.
Impact
This research contributes to ongoing discussions in Human–Computer Interaction and civic technology about designing equity-oriented data tools. It provides actionable design directions for broadband workers and community advocates who seek to use broadband maps as instruments of storytelling, representation, and local policy change.
The project also deepened collaboration with broadband organizations through the California Emerging Technology Fund (CETF) and the Digital Equity Coalition, and it informed future research on community-centered approaches to broadband mapping.